Latest updates
New cases:
69
Latest R(t):
1.48
Active Cases :
370
Positivity:
2.08%
Last update: 2022-06-04 00:00:00
City level analysis
Cumulative case count
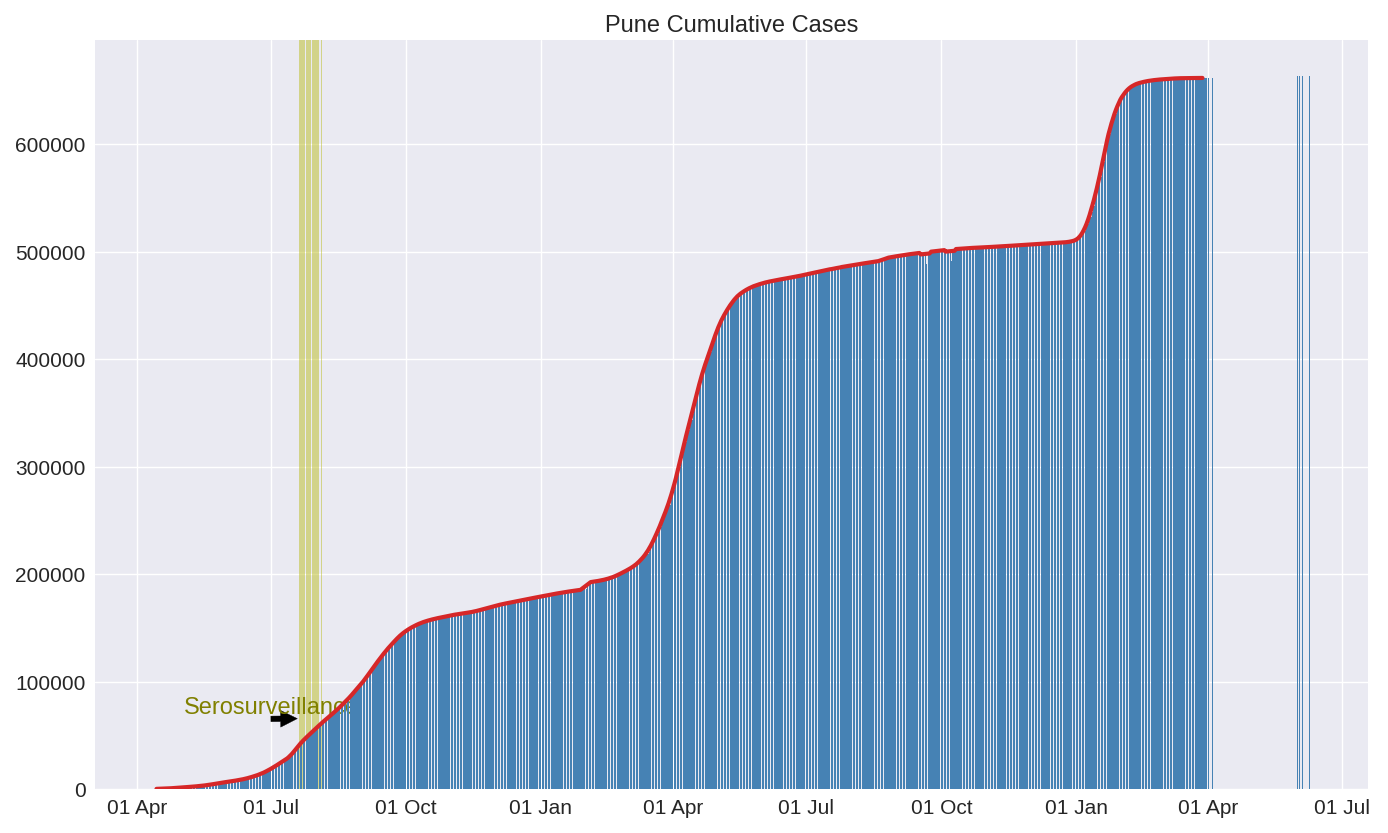
All the cases reported till date. This includes new as well as recovered/deceased cases.
Testing
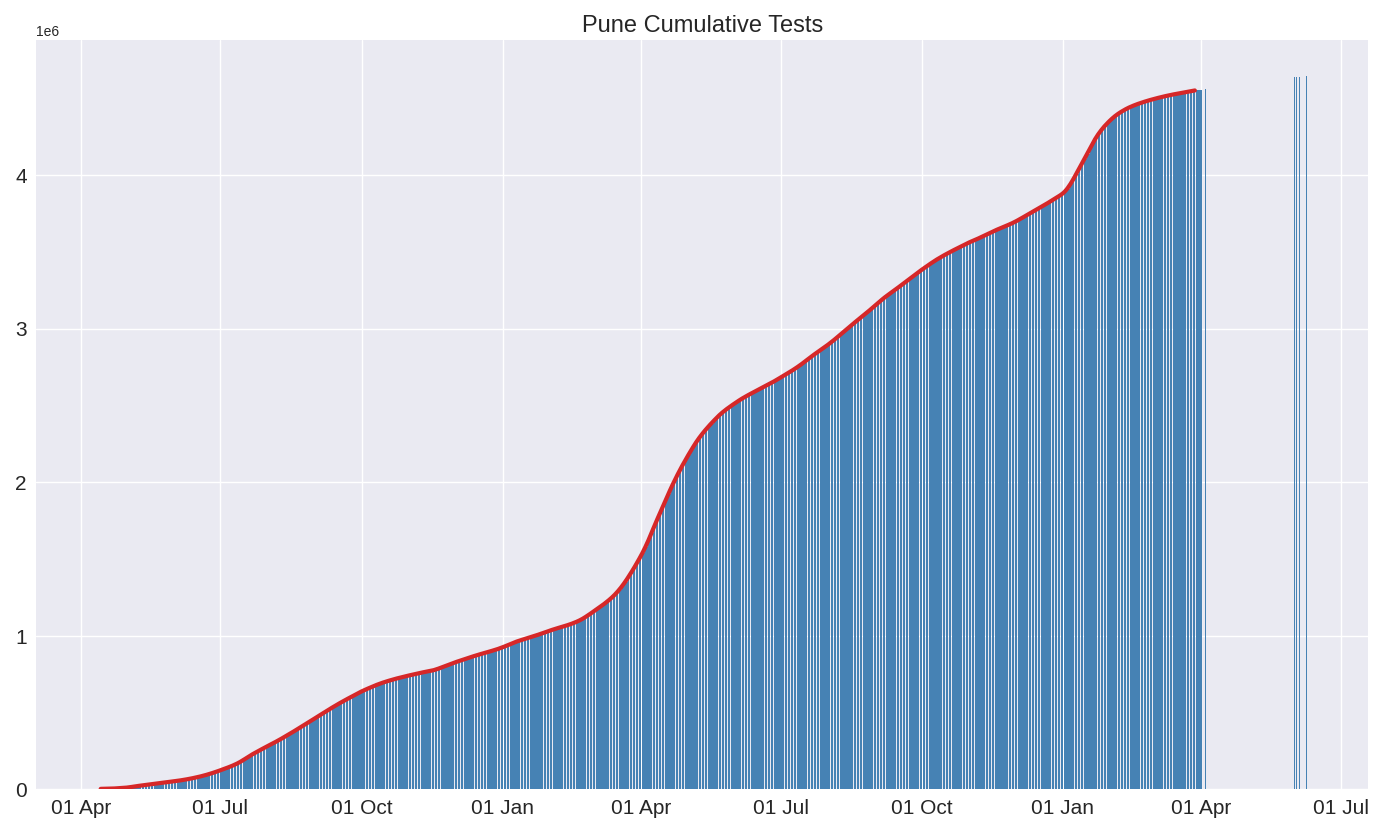
All the tests carried out till date.
Daily new cases
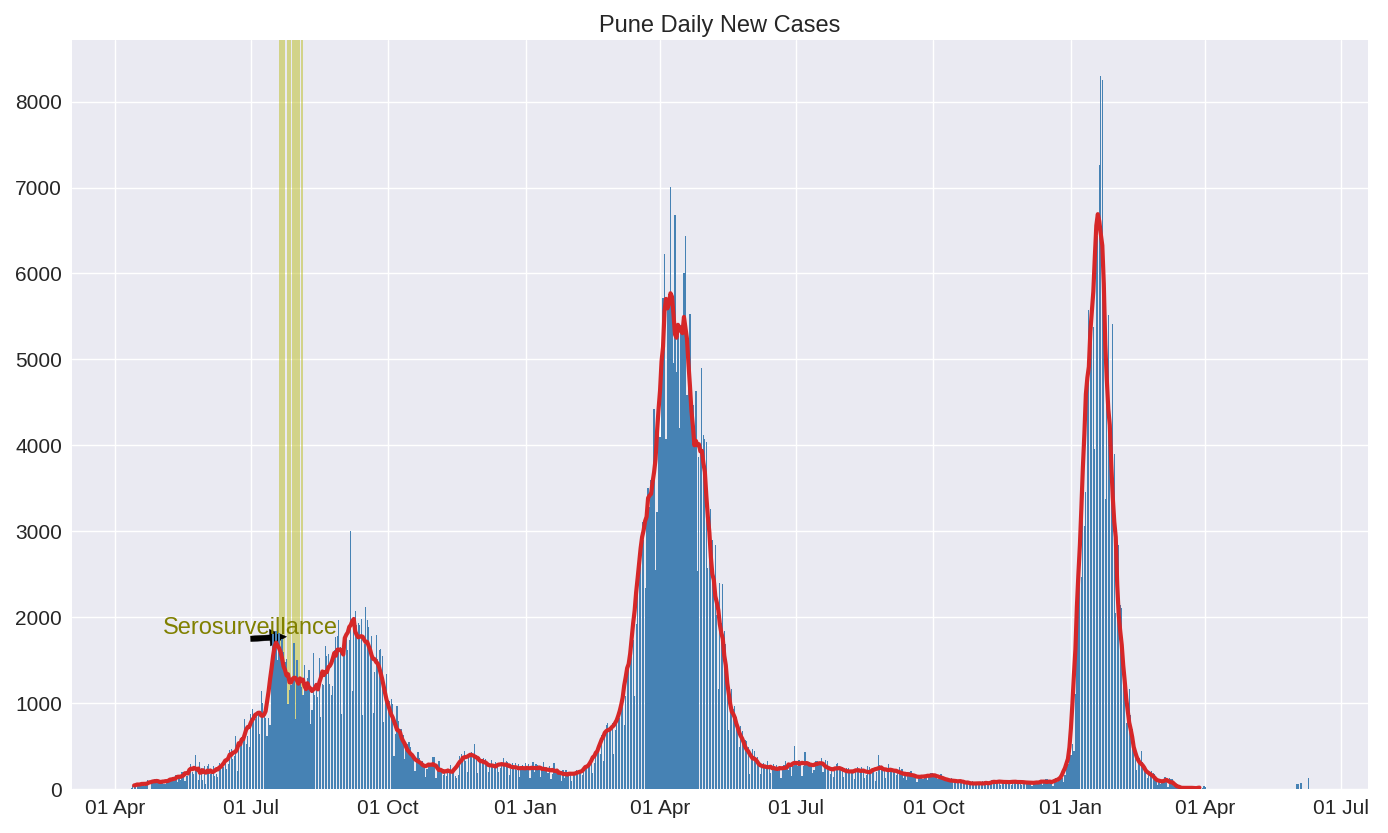
New positive cases detected on a given day.
Active cases
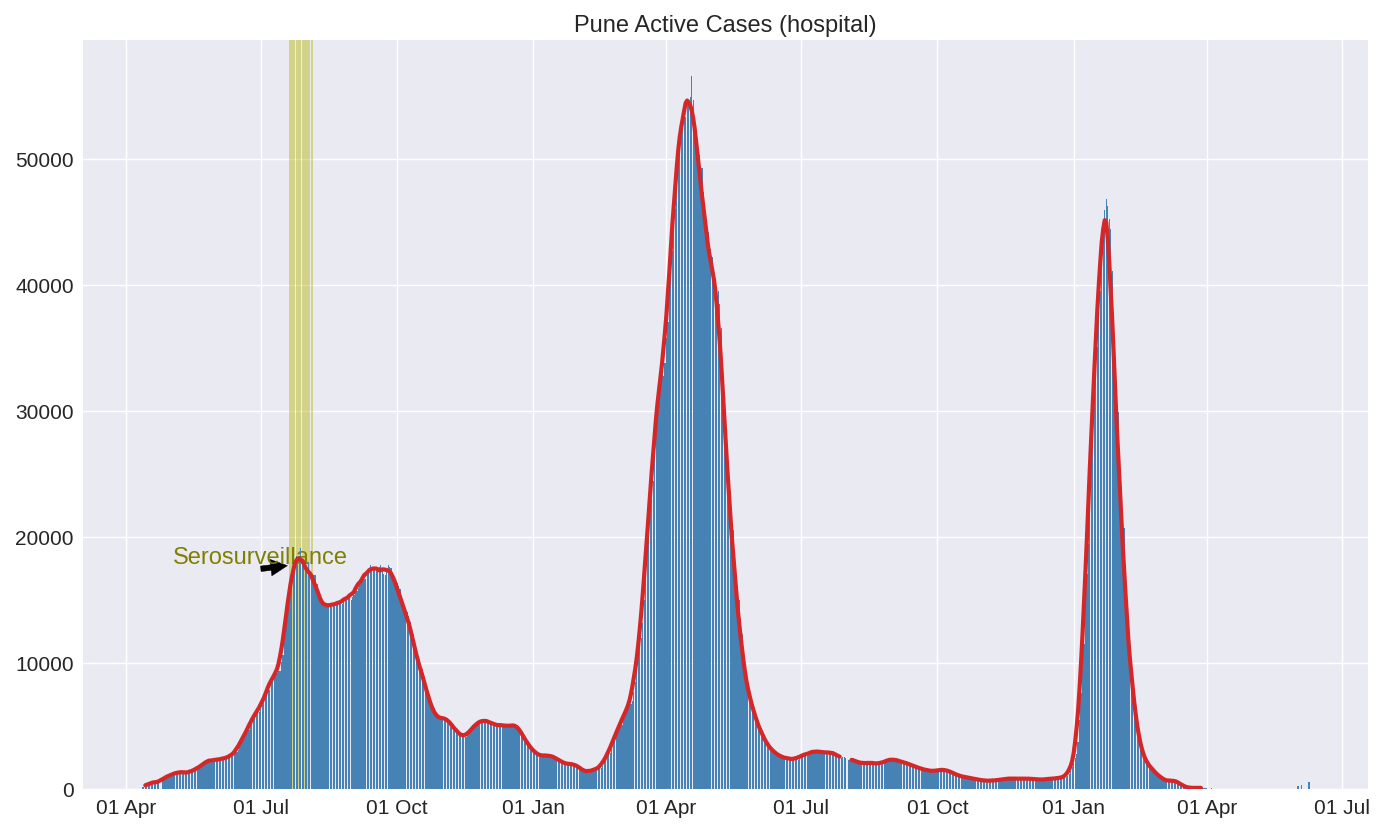
Cases that still active on a given day
Doubling time
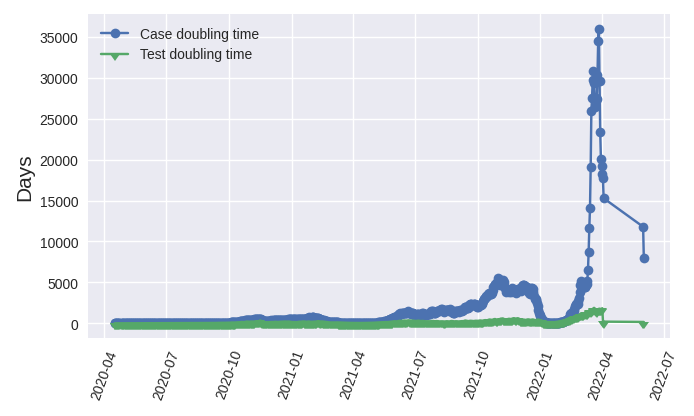
Days required for cases to double. Higher the number, for cases, better. Doubling time for testing should be lower than that for cases
Effective reproduction number R(t)
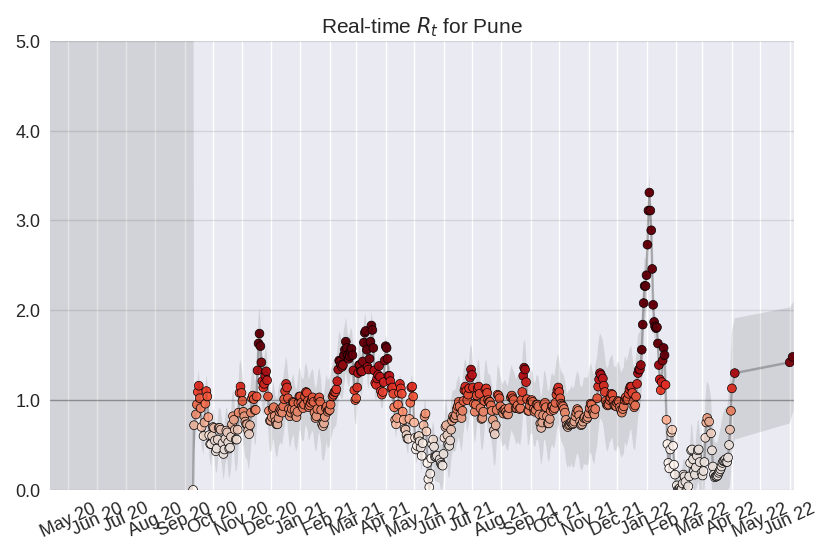
R(t) indicates the number of people a single infected person infects before recovering. R(t) less than 1 for sustained period of time is desired.
Active fraction
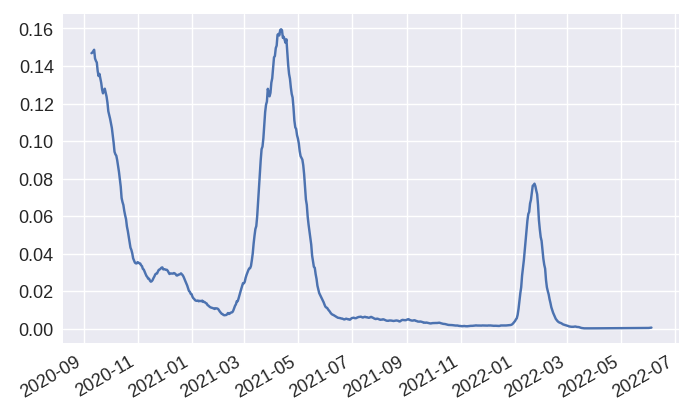
We plot the ratio of Active cases on the date, and Total number of cases till the date. At the beginning of the epidemic this ratio is 1, while at the end of the epidemic it is 0. Thus this ratio can be taken to be a rough measure of the stage of the epidemic.
Test positivity
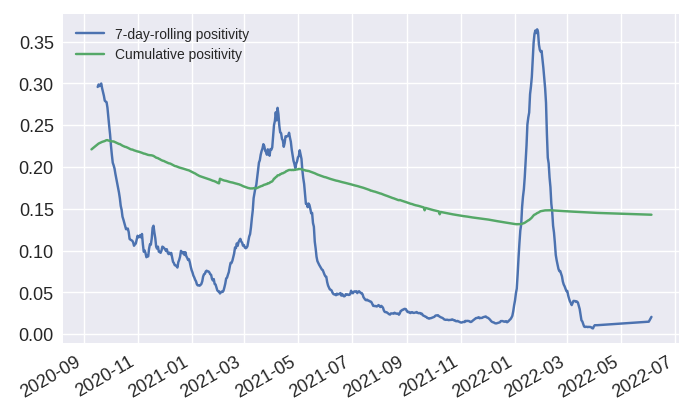
Test positivity is defined as the ratio of the number of detected positive cases to the total number of tests that have been done. It depends on (a) the prevalence of the infection in the region (b) The testing strategy. If most tests are done on cases which are clinically judged to have a high probability (e.g. symptomatic contacts of confirmed cases) the test positivity will be high. On the other hand if the tests are done more extensively it will be low.
Case Fatality Rate
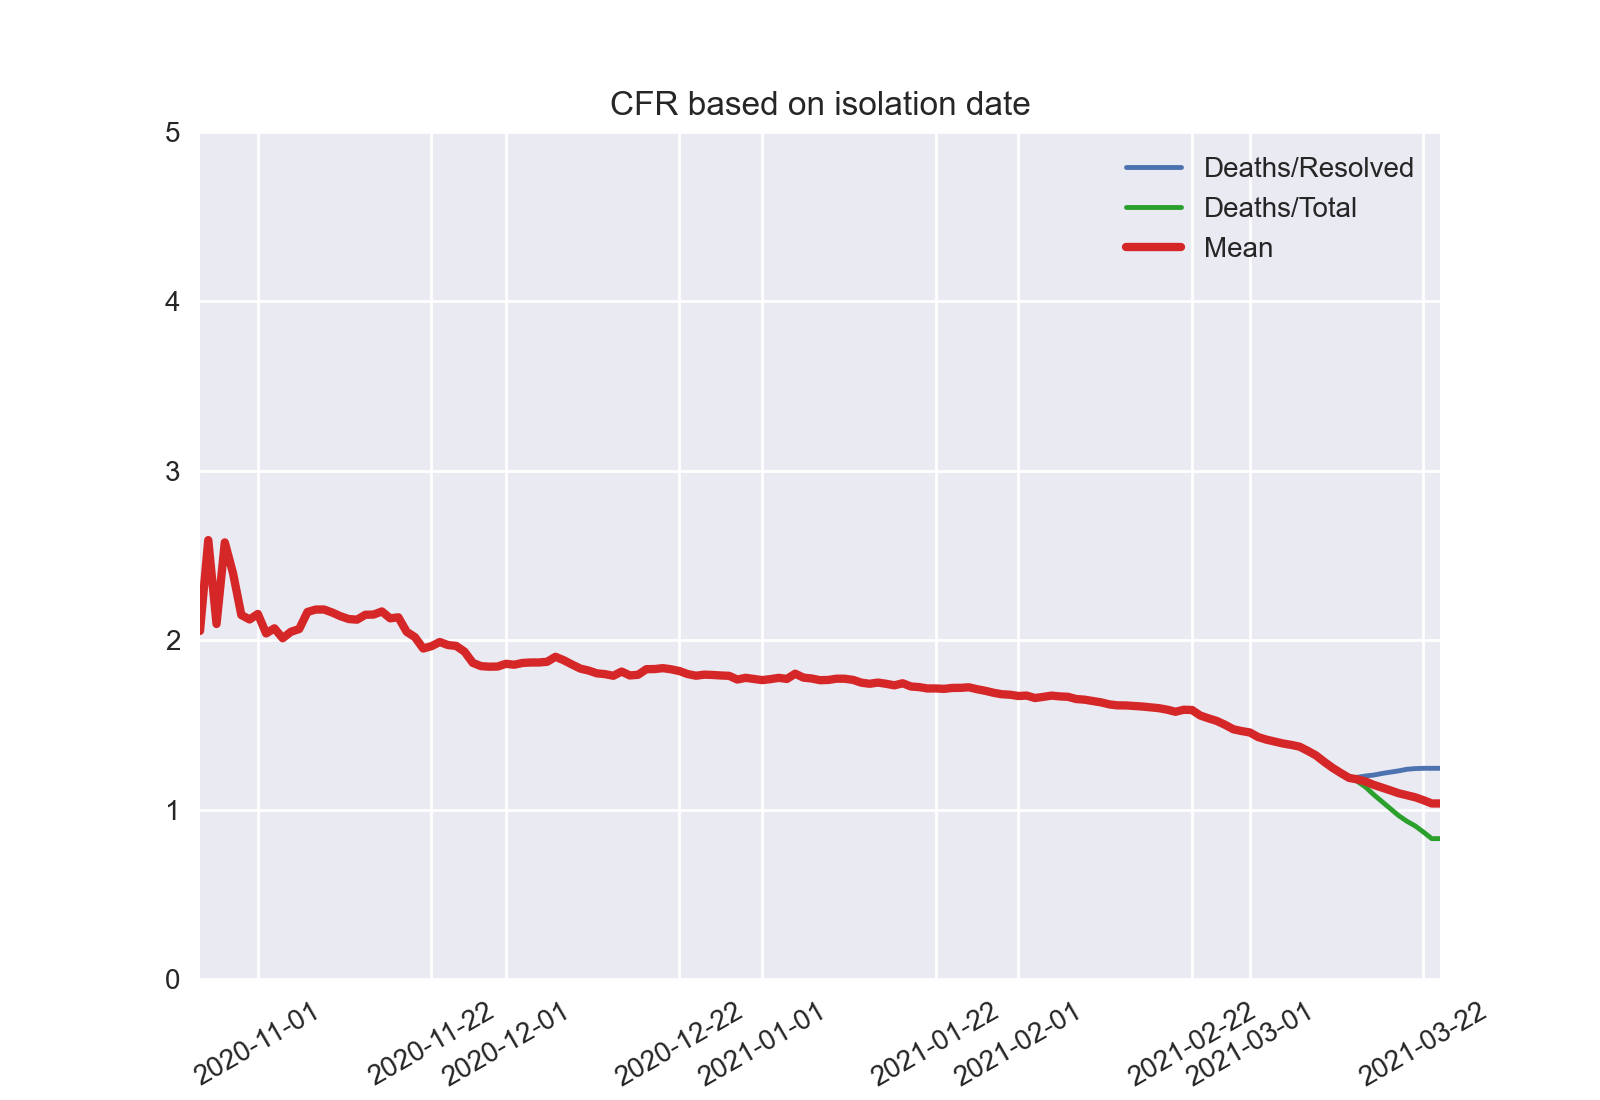
Case fatality rate (CFR) tells us the percentage of people admitted with SARS CoV2 who unfortunately die in the days after admission to the hospital. If the CFR reduces over time, this means that more people are recovering from the infection instead of passing away. In more recent days, there are still active cases and we don't know whether they will be discharged or will die. Active cases are called "unresolved cases" and those whose outcome is known (discharged or death) are called "resolved cases".
In the figure, there are three CFR curves for those dates when there are unresolved cases Blue line: CFR based on only resolved cases. This is likely an overestimate Green line: CFR based on both resolved and unresolved cases. This is likely an underestimate Red line: The mean of the Blue and Green curves. This is likely a better estimate then either the Blue or Green for the reasons stated above.
Ward level analysis
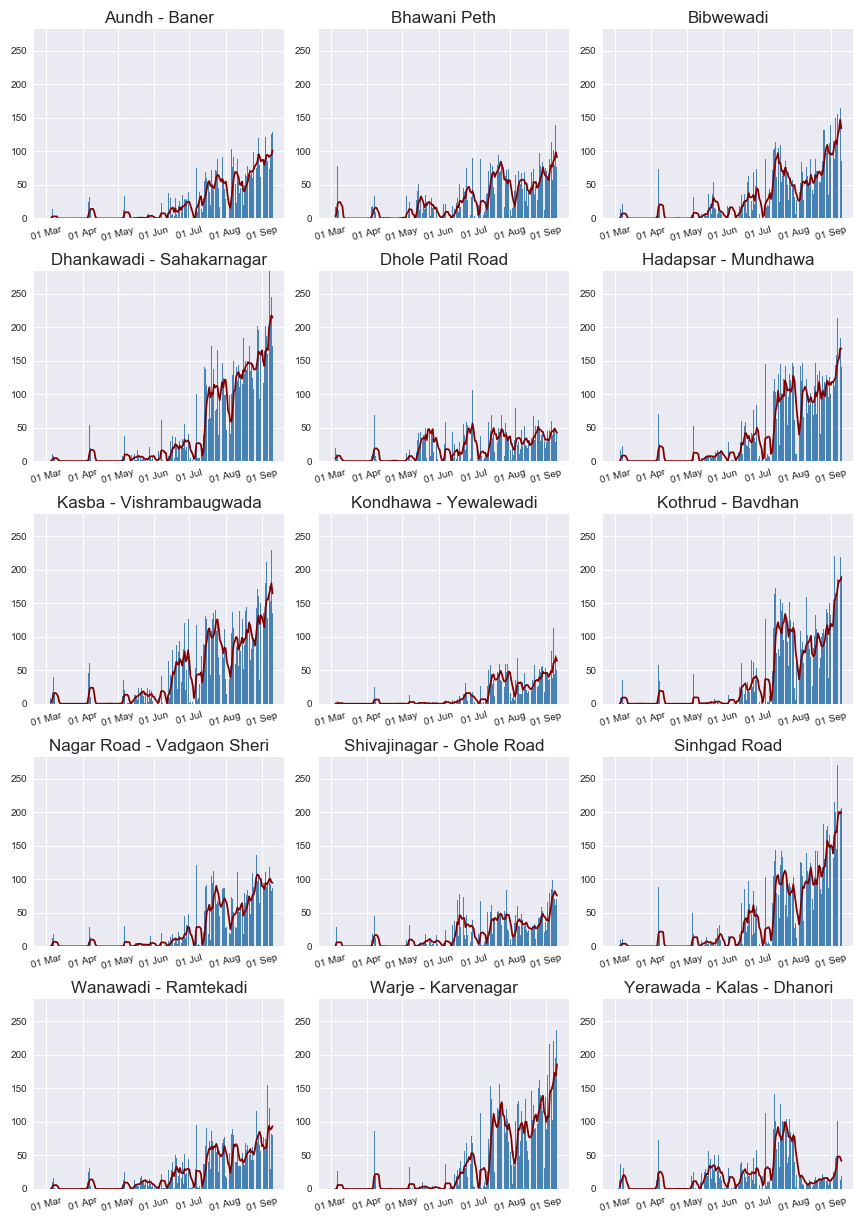
New cases reported on each day
Solid line shows the rolling average
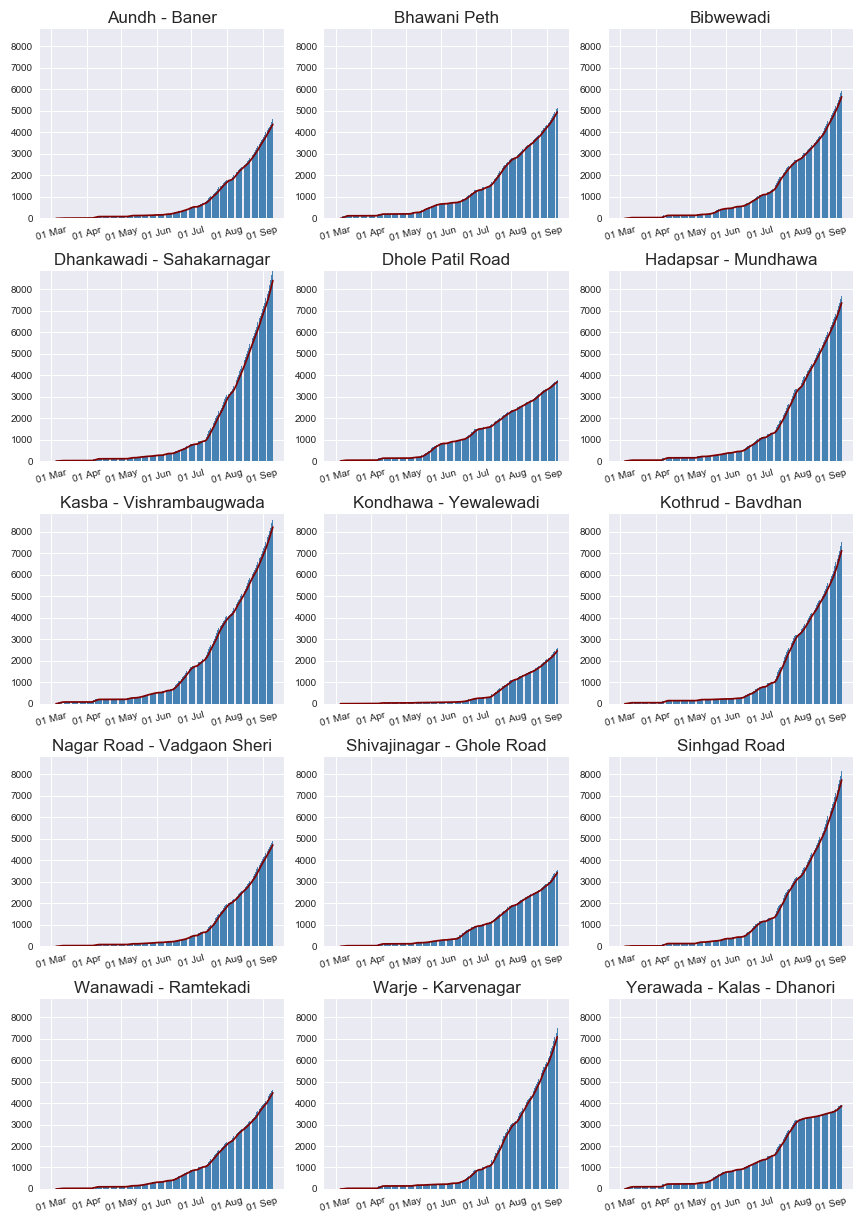
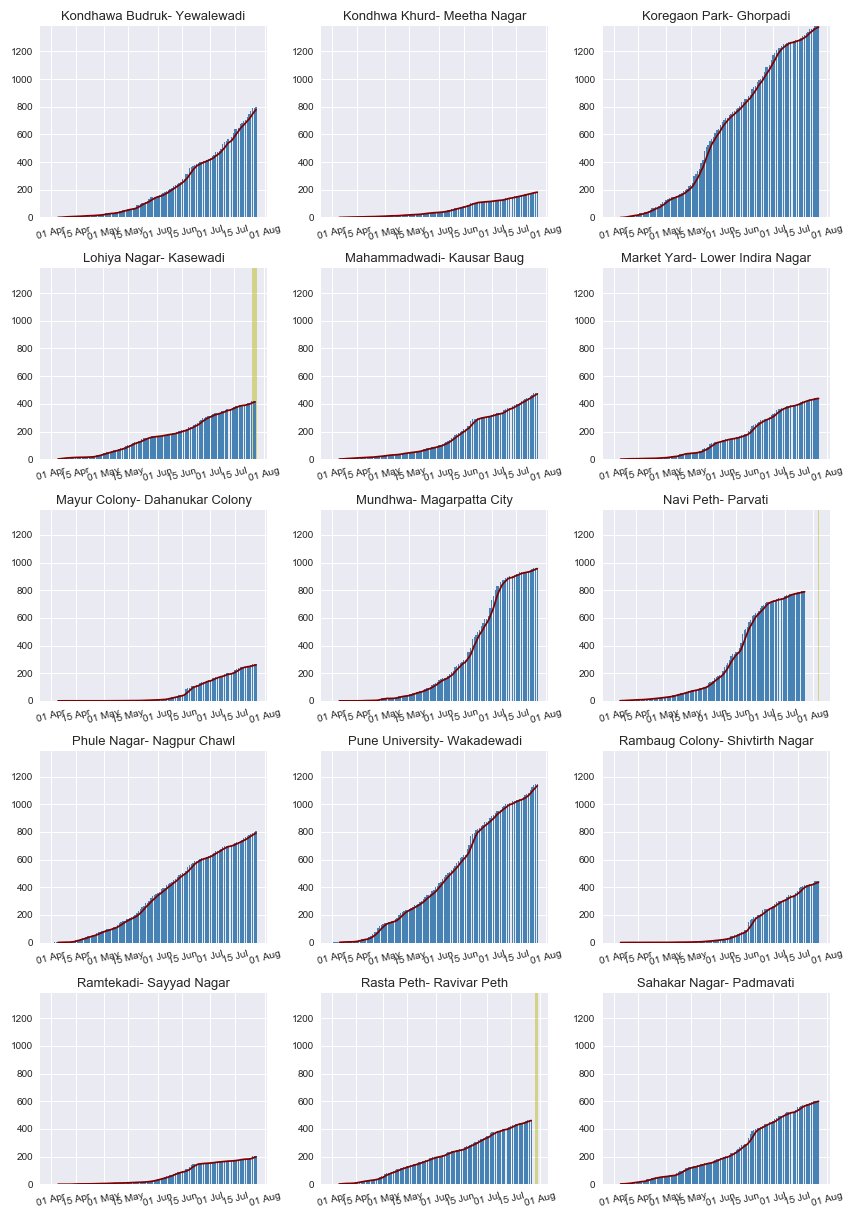
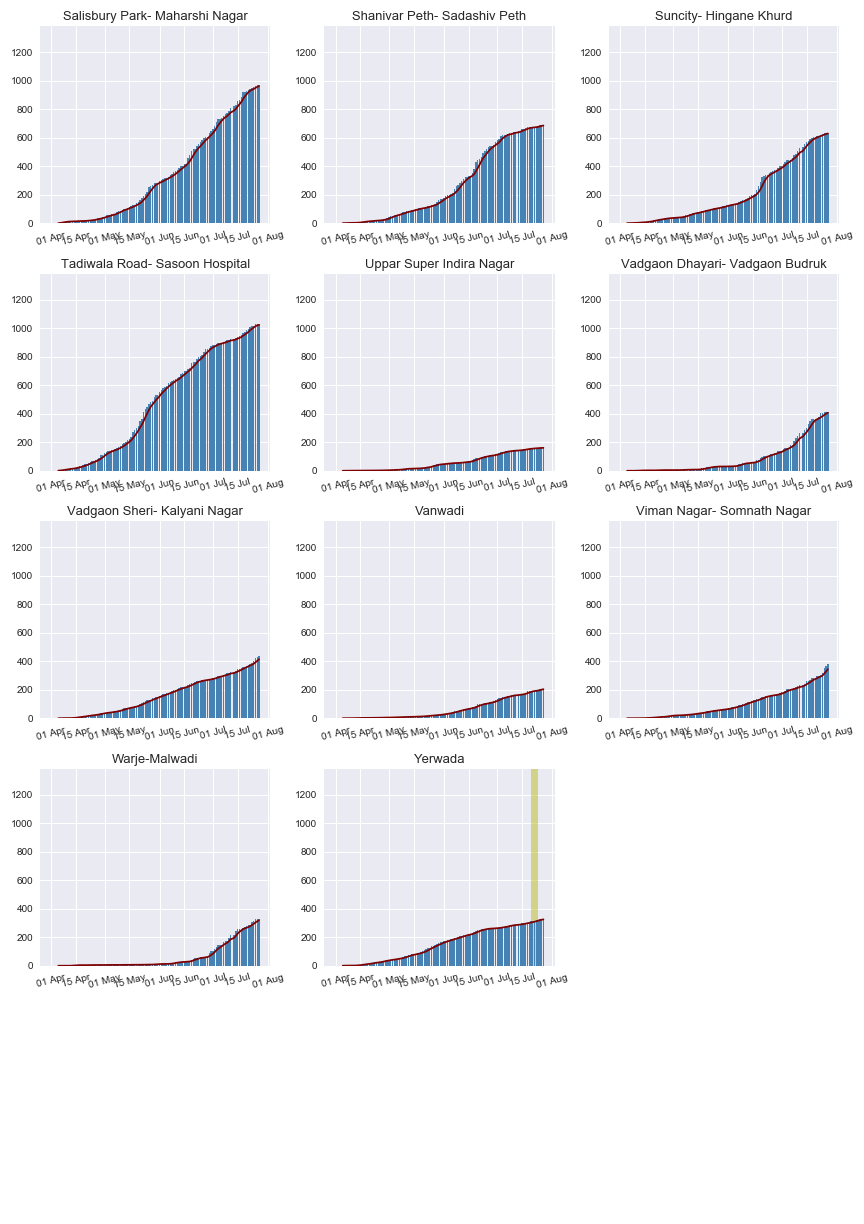
Cumulative cases
Solid line shows the rolling average
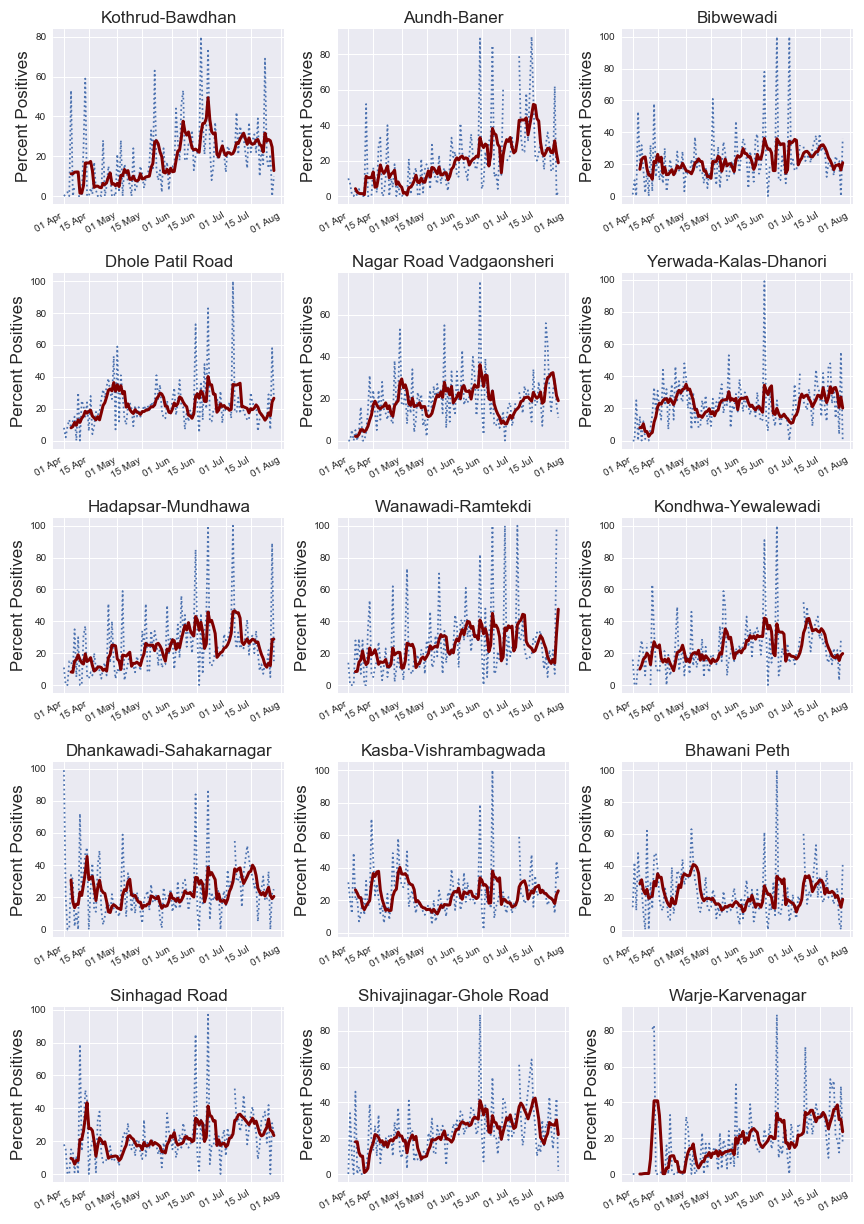
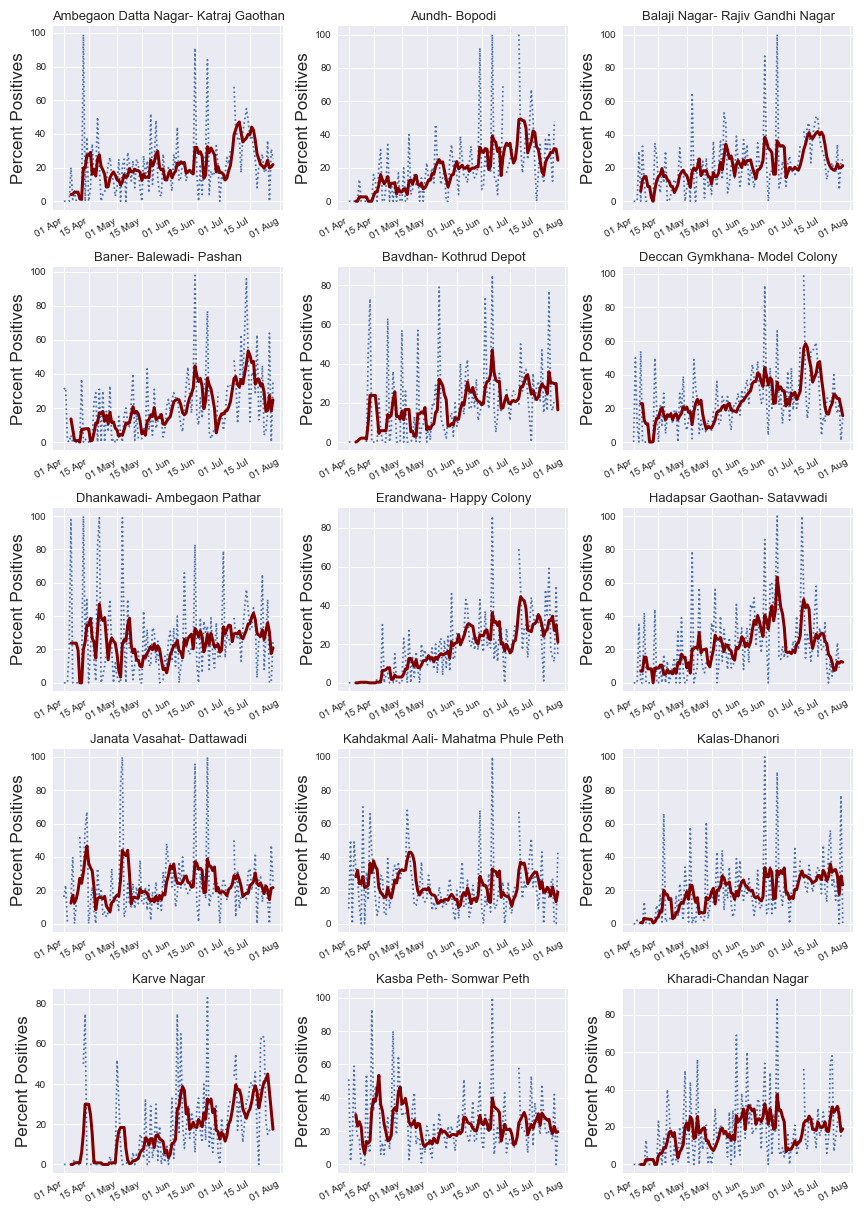
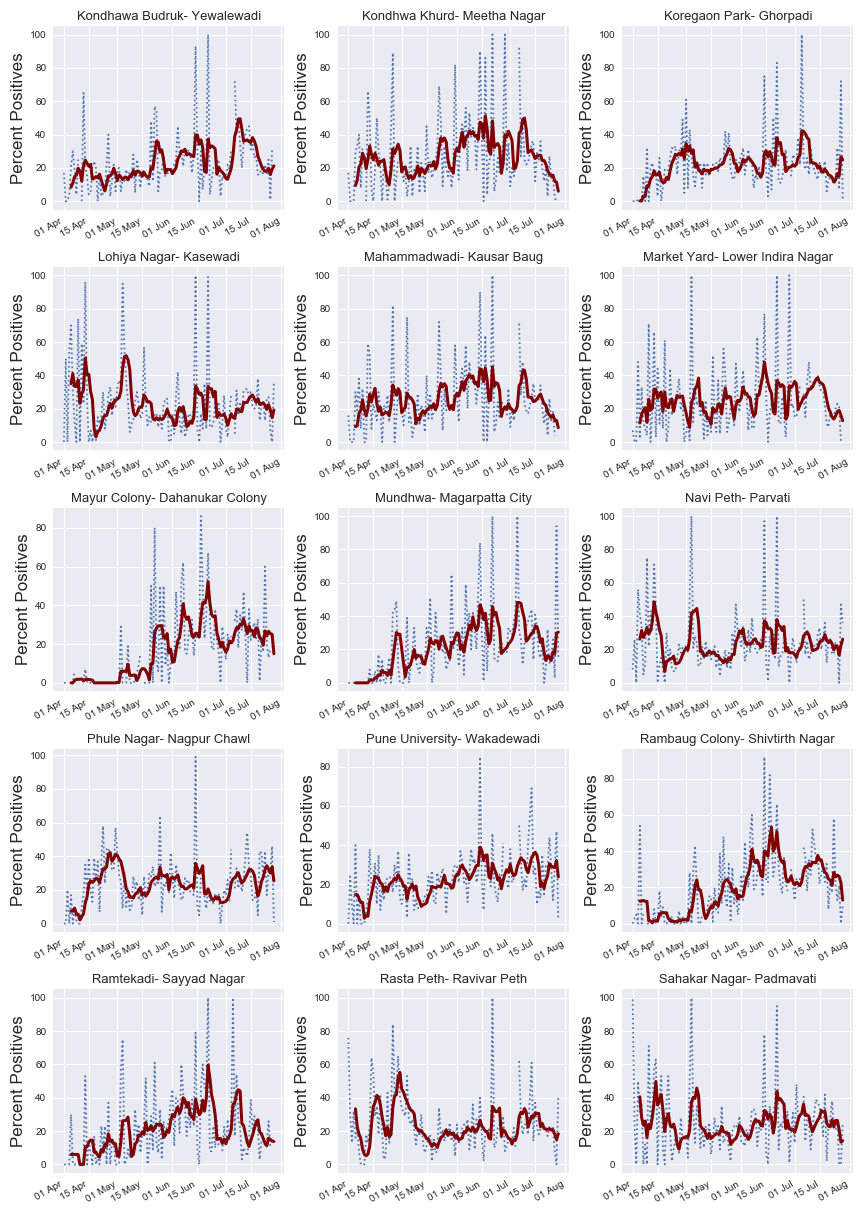
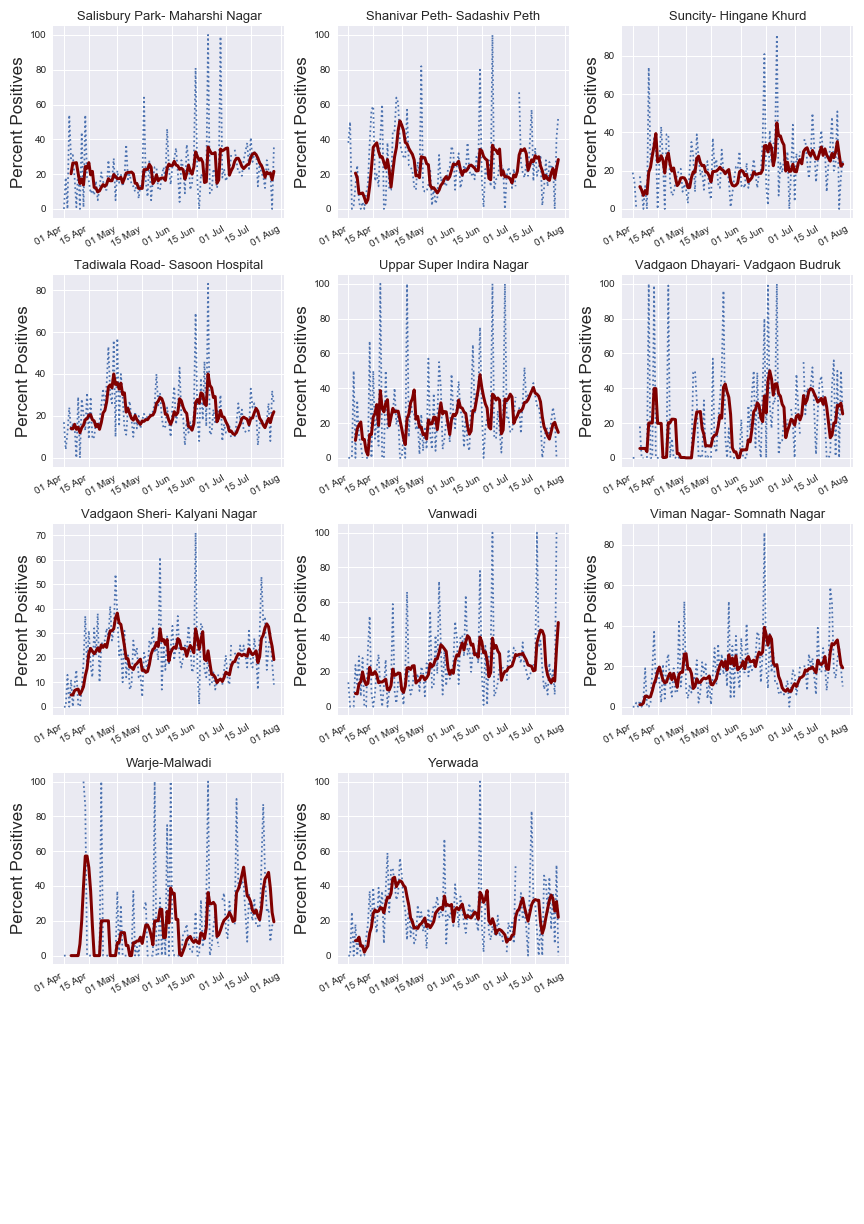
Test positivity (%) in each Prabhag
Solid line shows the rolling average
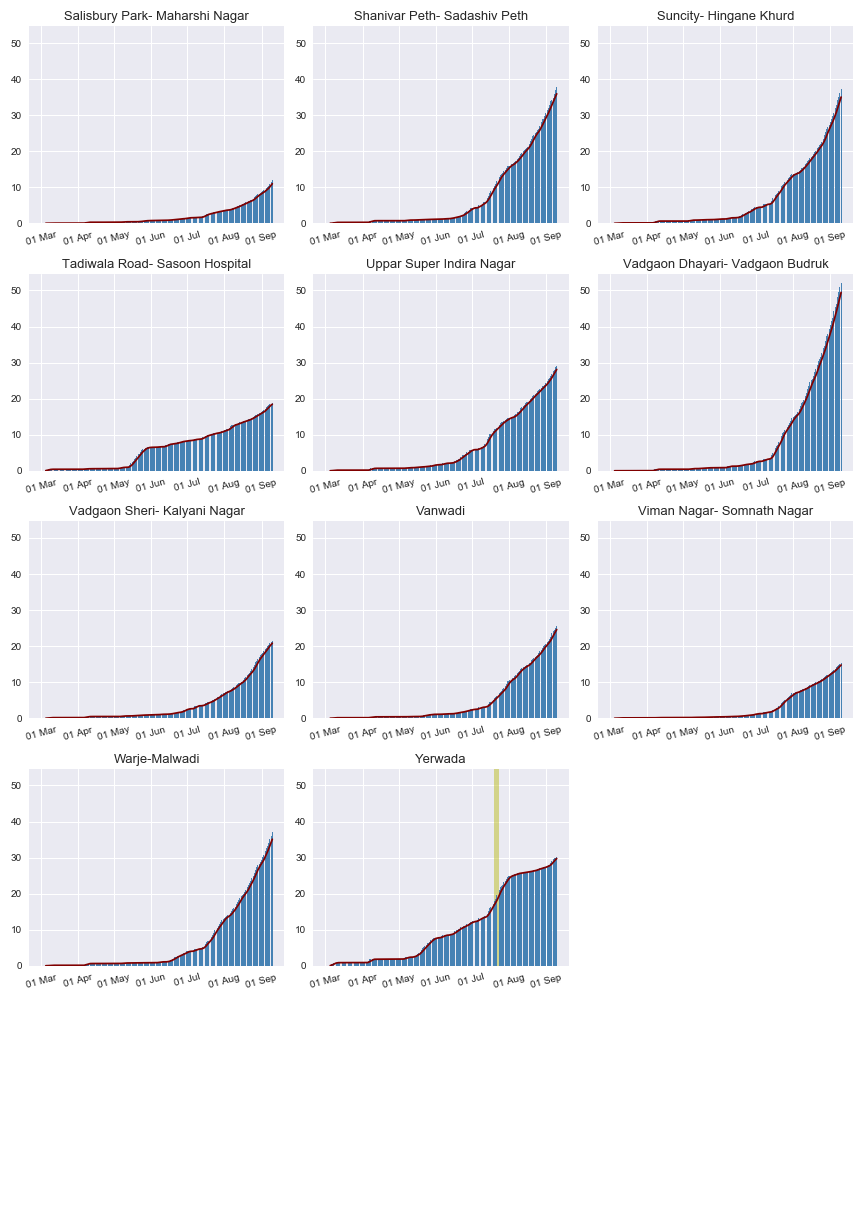
Prabhag level analysis
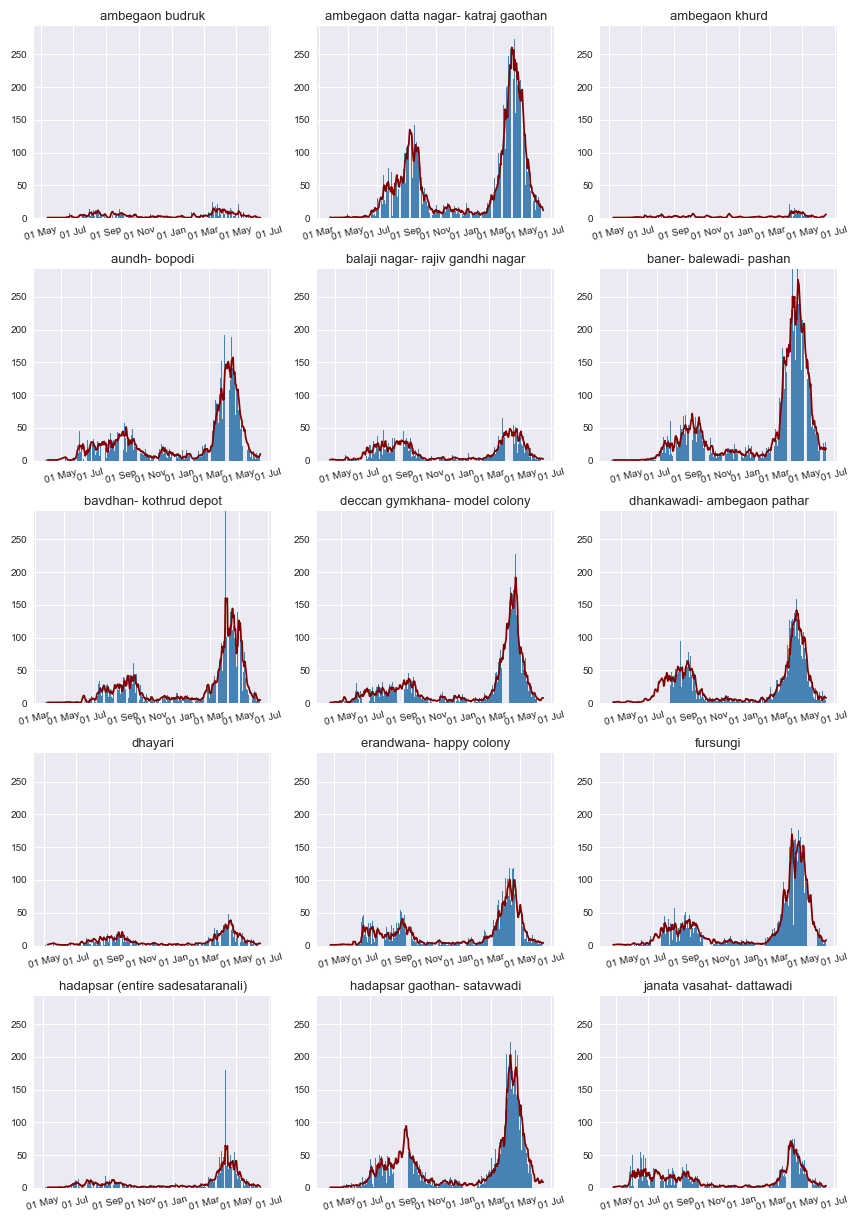
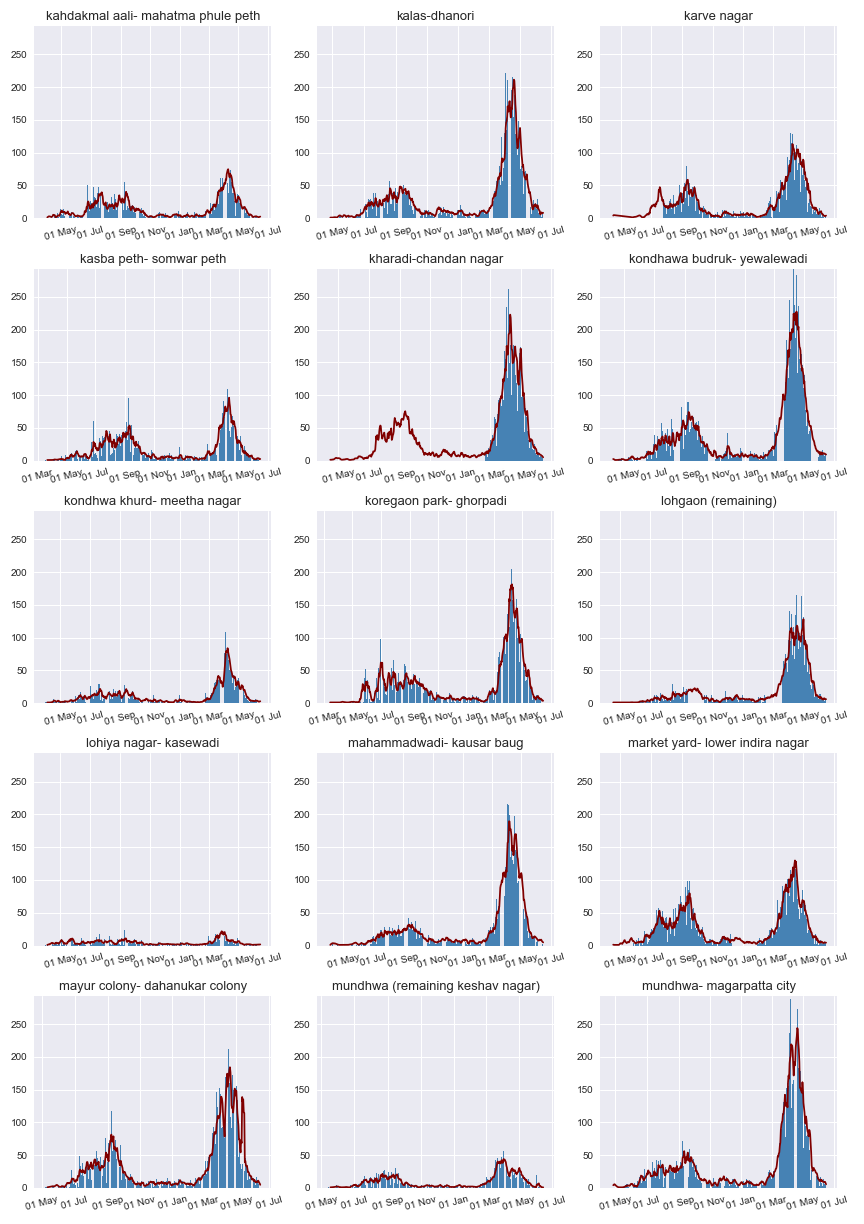
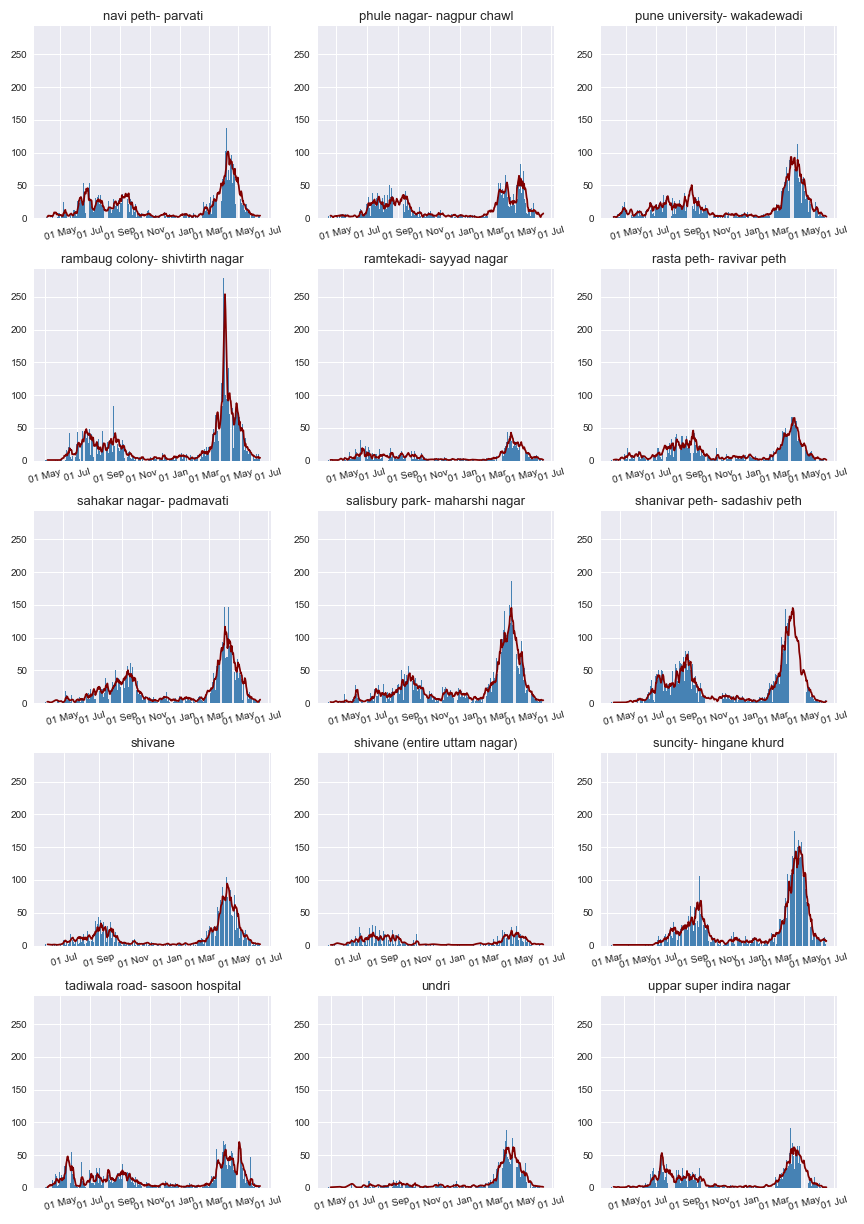
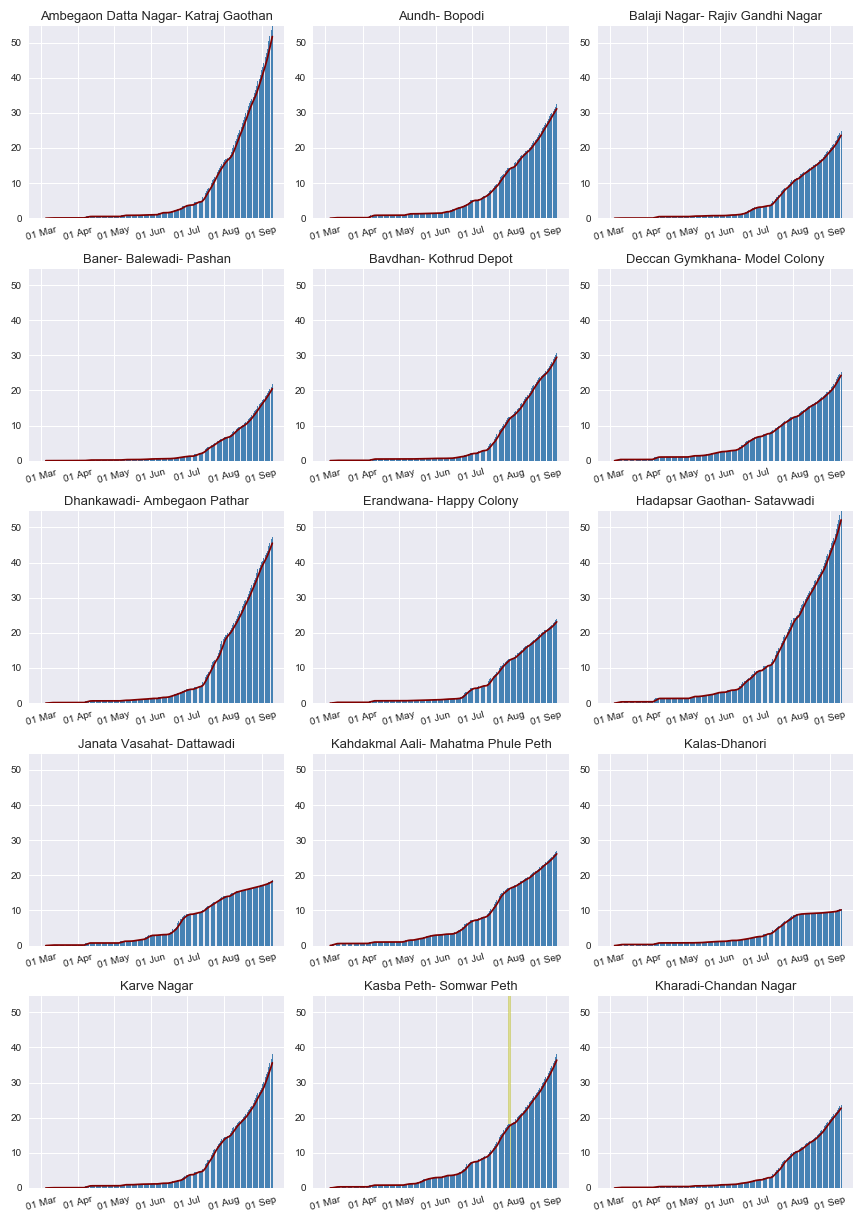
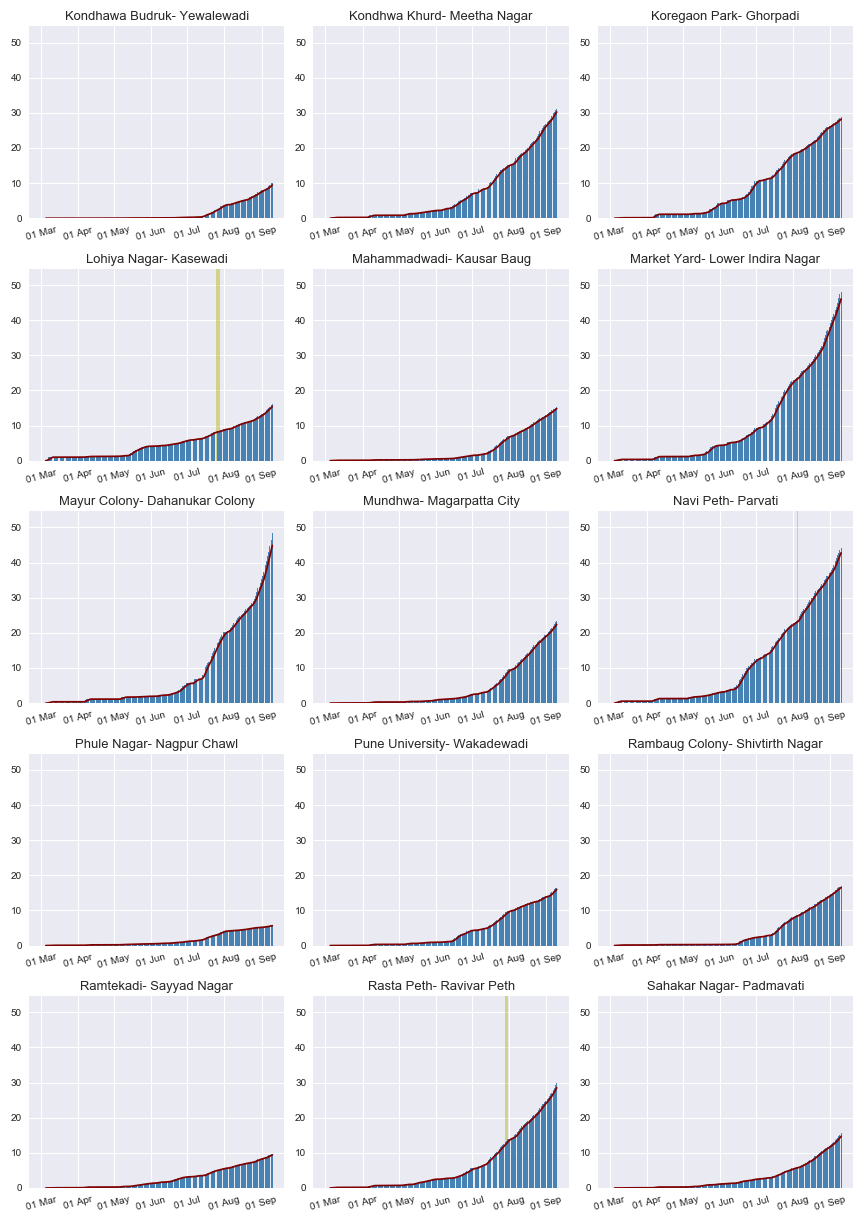
New cases reported on each day
Solid line shows the rolling average
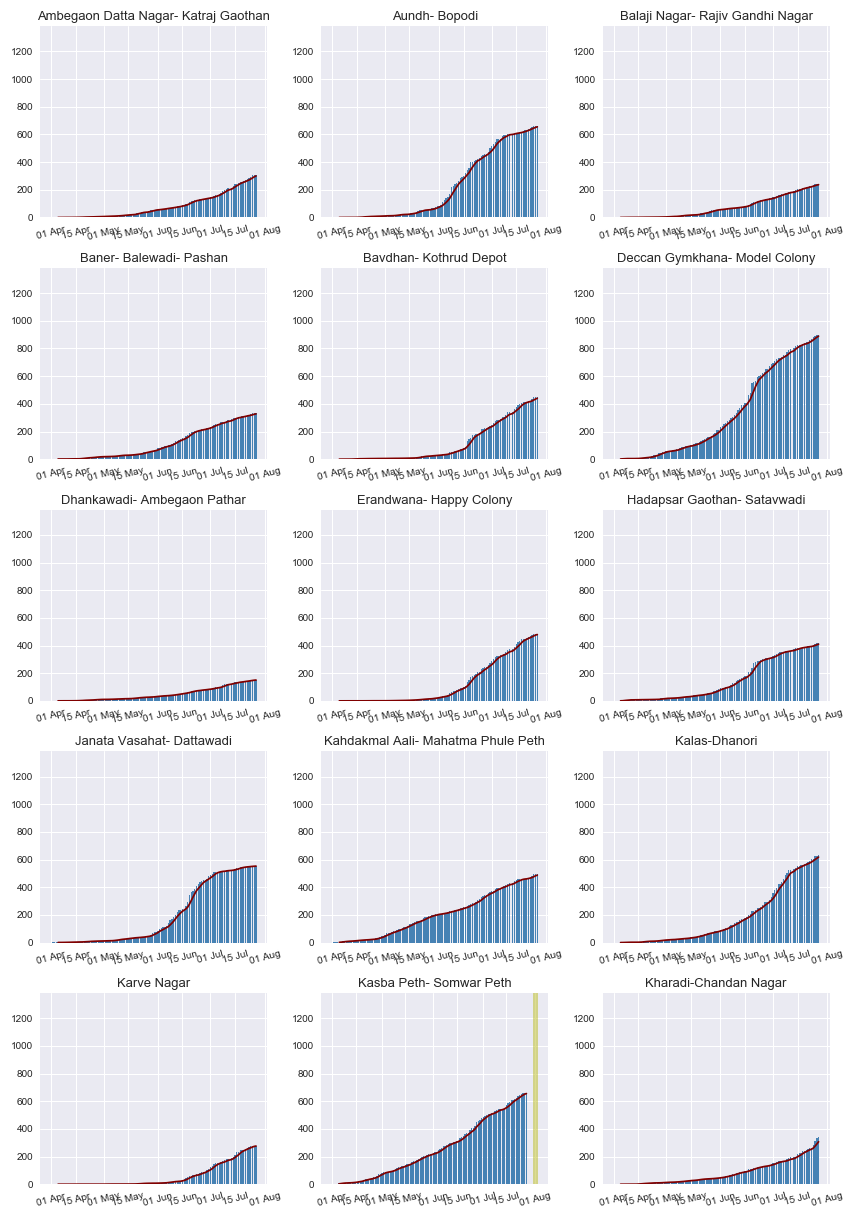
Cumulative cases
Solid line shows the rolling average
Cumulative number of cases per 1000 people
Solid line shows the rolling average
Cases per test
Solid line shows the rolling average
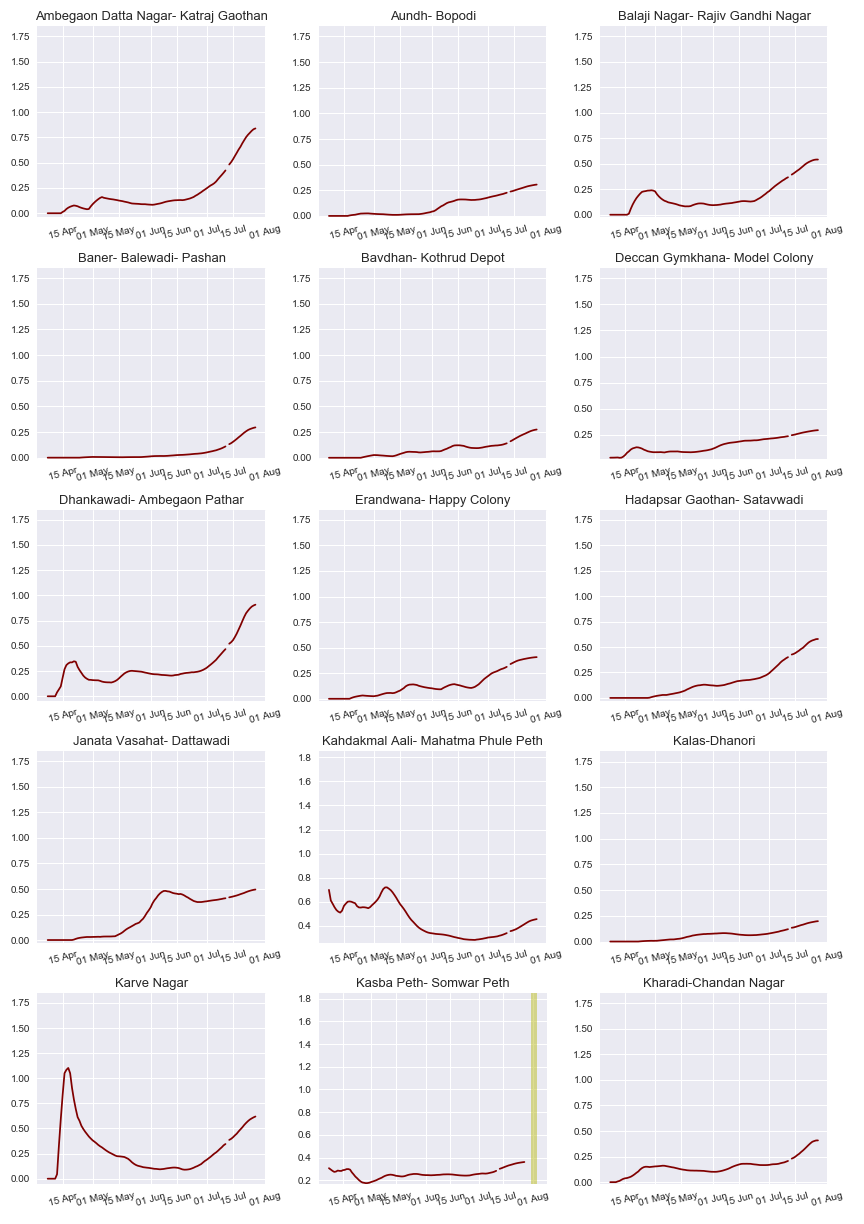
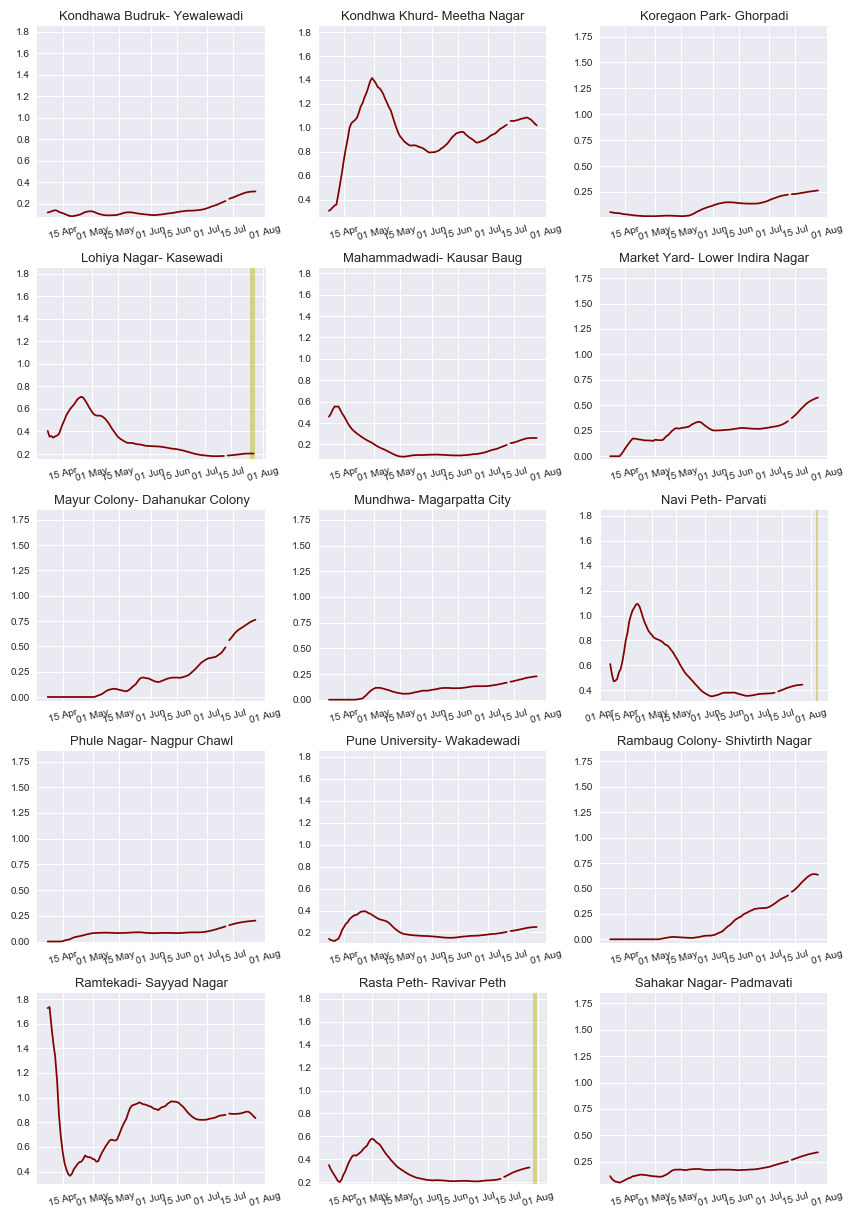
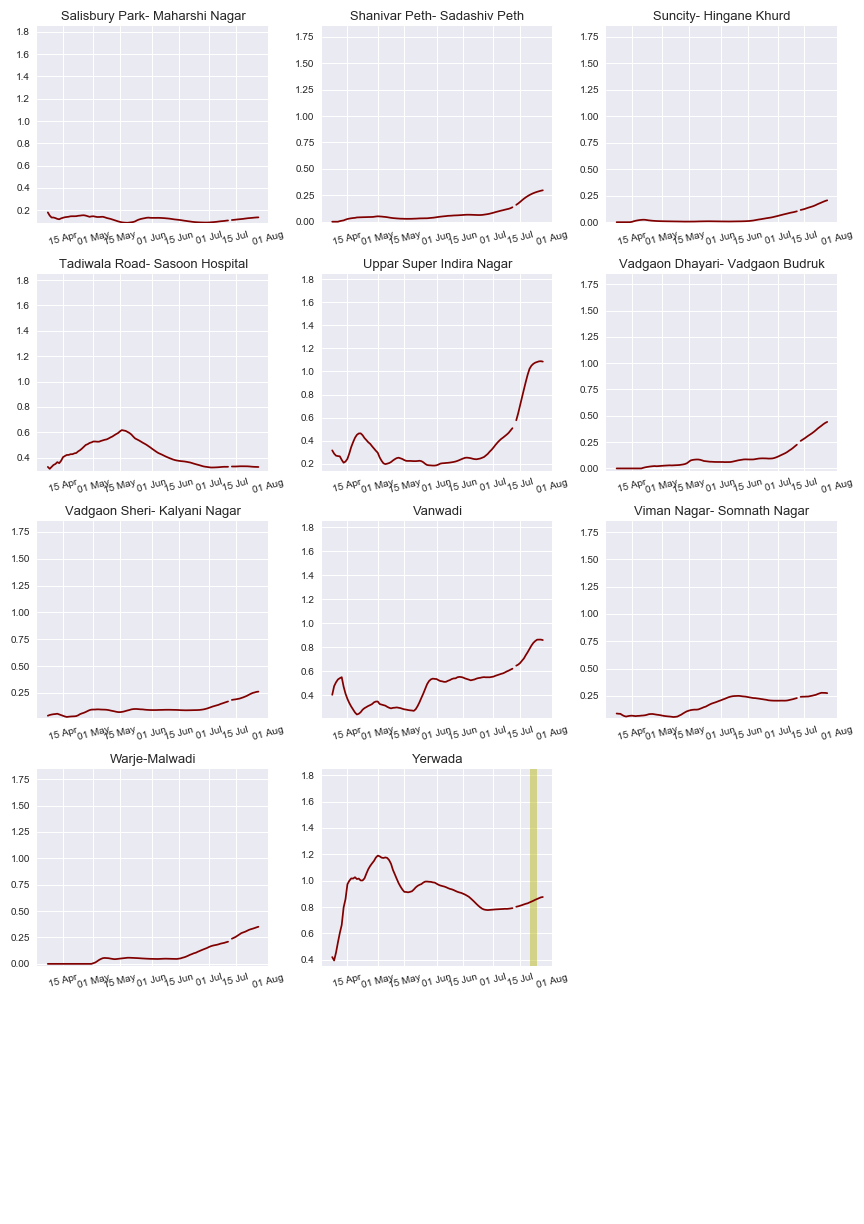
Test positivity (%) in each Prabhag
Solid line shows the rolling average
Serological Surveillance
Epidemiological and Serological Surveillance of COVID-19 in Pune City
Rationale: Global data suggests that a significant proportion of SARS-CoV-2 infections are asymptomatic and remain undetected unless populations are actively screened. Understanding the extent of infection in the population permits better understanding of the severity of COVID-19 and transmission dynamics.
Serological testing for antibodies against SARS-CoV-2 in a representative sample population can estimate the cumulative incidence of infection in the population. This study was undertaken to initiate generation of unbiased data important for gaining insights into the spread of the pandemic in Pune city and estimated the seroprevalence of antibodies against SARS-CoV-2 in five high-incidence prabhags (subwards)
The selected prabhags were Yerwada, Lohiyanagar-Kasewadi, Rastapeth-Ravivarpeth, Kasbapeth - Somwarpeth, Navipeth-Parvati.
SARS-CoV-2 IgG antibody seroprevalence in five high-incidence prabhags
| Number | Prevalence of Seropositivity (%) | 95% CI | |
|---|---|---|---|
| Prabhag 6 Yerwada | 367 | 56.6 | 51.5-61.7 |
| Prabhag 16 Kasbapeth-Somwarpeth | 352 | 36.1 | 31.1-41.1 |
| Prabhag 17 Rastapeth-Raviwarpeth | 335 | 45.7 | 40.4-51.0 |
| Prabhag 19 Lohiya Nagar-Kasewadi | 312 | 65.4 | 60.1-70.9 |
| Prabhag 29 Navipeth-Parvati | 298 | 56.7 | 51.1-62.3 |
| Overall Average | 1664 | 51.5 | 49.1-53.9 |
Sero-Surveillance Team
Principal Investigators:Aarti Nagarkar (SPPU, Pune);
Aurnab Ghose (IISER Pune).
Co-Investigators:Abhay Kudale
(SPPU, Pune), LS Shashidhara (Ashoka University, on lien
from IISER Pune); Susmita Chaudhuri and Guruprasad
Medigeshi(THSTI, Faridabad)